An interview with Jere Confrey about her Gates Foundation and NSF-funded project to build and validate learning trajectories (LTs) for grades 6-8 mathematics around rational number reasoning.
What is the big idea of your project work?
Our team is working on an interactive learning map in for middle school math. This work is part of our Scaling Up Digital Design Studies (SUDDS) project work, with funding from NSF and the Bill & Melinda Gates Foundation.
A learning map, in contrast to a straight disciplinary map, is a map that is based on research on learning and tries to delineate the landmarks/or obstacles that are essential to understanding a big idea. Our learning map helps teachers create personalized learning resources for students in middle grades math in a coherent way. It supports flexible grouping based on students’ choices, paths, and performance.
What does the interactive learning map cover and how does it work?
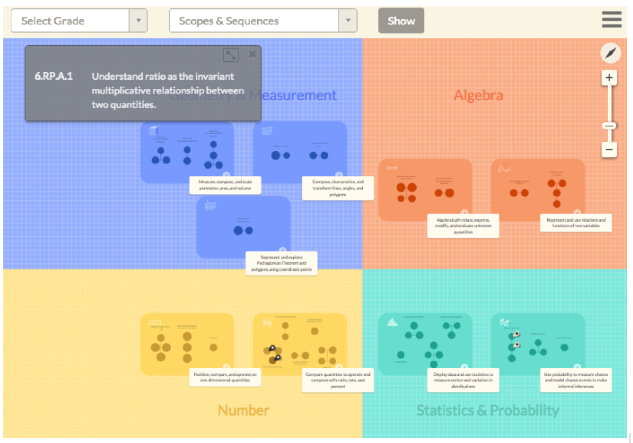
Our middle school map covers 4 fields: Geometry & Measurement, Algebra, Number, and Statistics & Probability (see Figure 1). Within each field you see boxes, which we call regions or “big ideas” of learning math. There are 9 big ideas across the fields. If you click on a region label, you can see what it stands for. So in Numbers, the two big ideas around middle grades are one-dimensional number (how do you locate things on the number line, what’s bigger/smaller, what’s the order of fractions and decimals); and the second is ratio, rate and percent. In Statistics & Probability, there is displaying data using statistics around centered variation, and probability and inference.
Figure 2. Middle school map covering 4 fields. Each field contains regions or big ideas, each of which contain clusters of constructs.
If you double click on a big idea, it zooms in and you can see circles that we call “clusters”. The circles are constructs that go together to make up an idea. So if you look at key ratio relations, there’s identifying ratio equivalents, finding base ratios, and finding unit ratios. The structure reflects that they first need to learn ratio equivalents, and then they can learn these other two in any order. The idea is that instead of big unidimensional learning trajectories, they are broken down into clusters. A learning trajectory at the level of a construct can still cross grades but they are more compact than in my previous work.
If you click on a construct within a cluster, like Identifying Ratio Equivalence, it will expand and show a window that we call a stack (see Figure 2). The stack is the delineation of the learning trajectory and shows that when you’re learning ratio equivalence, the first thing you have to learn is that you can make more of something and maintain the same ratio, like in a recipe for lemonade that you double. When the numbers are even, it’s easier for kids to do it than when the numbers are odd. As you go up the stack, you’ll see that at 6th grade, students should learn all of these proficiency levels in that stack. If you click on CCSS-M at the bottom, it puts up the standards that are associated with this particular construct. And you can go the other way, too: when you click on a standard, it shows you what constructs it corresponds to on the map. Another major change from my prior work (turnonccmath.net) is that a standard can be associated with multiple locations on the map.
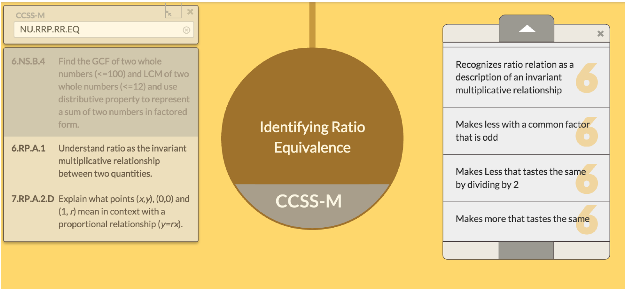
Figure 2. The Identifying Ratio Equivalence construct and corresponding stack and link to CCSS-M standard.
How do teachers use the map?
We think the map is useful to organize the mathematical space. We’re designing it for teachers to use with classes, and home schoolers could also use it. One concern we have is that there’s a drift on the web toward individualized learning and instruction. Our cyberlearning and science of learning community knows how important discourse and interaction are. So we are designing this to try to support teachers who want to do interactive classes but still respond to the diversity of needs among their students.
We also have a way that teachers can build a scope and sequence for the year based on which regions are taught or not taught, and in what kind of order, and then they can go in and order the clusters (see Figure 3). Below the clusters we don’t let them order them because we want those things taught in a certain order as related learning concepts. From the concepts, we also link out to resources on the web. We are populating the map this summer.
Figure 3. An example scope and sequence for a year that reflects what big ideas and constructs a teacher chooses to teach, and in what order.
So that’s the notion of the learning map – being able to use web resources and getting teachers deep information about how kids think. In our NSF project, we are building diagnostics for each of the clusters so that when students finish a cluster, they can take an assessment and the assessment will give them feedback on how well they’ve learned the topics. Teachers can use this information to group students or students can use it to find other students to work with.
What do you sees as unique about your work?
NSF Project Information
Title: Completing, Validating, and Linking Learning Trajectories for K-8 Rational Number Reasoning Tied to the Common Core Standards
Award Details
Investigators: Jere Confrey, Alan Maloney
I think of this whole thing as a digital learning system, and this is where I think the field’s going to go. It’s not complete now; this is really the bookends: The navigation and the information on the underlying concepts that kids need to learn and what it looks like when they’ve learned it. It also leverages visualization to make navigation of Common Core easy and intuitive. But you still need the middle part: how do you create a workspace where kids can use mathematical tools as they solve problems. All of that, and the backend analytics, would have to be built. But you’re seeing two critical components.
Learn more about this work on the Scaling Up Digital Design Studies (SUDDS) project web site.